When a beam is subjected to loads, their effects are not limited to the visible external forces. Inside the structure, support reactions, shear forces, and bending moments are generated continuously along its length. If an engineer wants to know where the stress is highest, where yielding may begin, or whether finite element analysis results are physically reasonable, the first things to examine are often the shear force diagram and the bending moment diagram.
Bending moment diagrams and shear force diagrams are fundamental tools in structural mechanics because they show how loads are transferred through a member in a compact and physically meaningful way. They are widely used in hand calculations, design checks, and finite element model validation for a simple reason: they reveal the beam’s internal force state in an intuitive form.
Shear Force Diagram
A shear force diagram shows the internal transverse force at every position along a beam. The simplest way to understand it is this: imagine making an imaginary cut at some point in the member and isolating one side. To keep that cut segment in equilibrium, an internal force must act at the section. This internal force is the shear force.
In practical terms, the shear force diagram shows how vertical loads are transferred internally. Its shape is directly controlled by the applied loads:
- A concentrated force causes a sudden jump in the shear force diagram
- A uniformly distributed load causes the shear force to vary continuously — if the load is uniform, the shear force diagram is linear
- In a region with no distributed load, the shear force remains constant over that segment
Diagnostic Value
The shear force diagram has extremely high diagnostic value. Even before exact numerical calculations are performed, engineers can usually predict the qualitative shape of the shear force diagram from the loading pattern alone. This is precisely where its powerful “a picture is worth a thousand words” value lies.
Bending Moment Diagram
A bending moment diagram shows the internal bending moment at every position along a beam. Similarly, imagine cutting the beam and applying equilibrium constraints to one side — in addition to the internal force, an internal couple is usually required to prevent that segment from rotating. This couple is the bending moment.
This quantity is directly related to beam behavior. In classical beam theory, bending moment is related to curvature by the following relationship:
M: bending moment
E: modulus of elasticity
I: second moment of area
κ: curvature
Therefore, a bending moment diagram is not merely an abstract plotting tool. It tells you where the beam bends most intensely. In many common problems, the location of maximum bending moment is also where the bending stress is greatest.
Mathematical Relationship Between Shear Force and Bending Moment
There is an important mathematical relationship between shear force and bending moment: the slope of the bending moment diagram is equal to the shear force value. This means the bending moment diagram cannot be drawn independently of the shear force diagram.
- If the shear force is constant, the bending moment varies linearly
- If the shear force varies linearly, the bending moment is a quadratic parabola
- If the shear force crosses zero, the bending moment usually reaches a maximum or minimum at that point
Differential Relationships Among Load, Shear Force, and Bending Moment
The relationships among load, shear force, and bending moment are governed by two differential equations:
The derivative of shear force with respect to position equals the distributed load intensity, with a negative sign
The derivative of bending moment with respect to position equals the shear force value
Here, w(x) is the distributed load, V(x) is the internal shear force, and M(x) is the internal bending moment.
These two equations reveal the complete logic behind constructing beam diagrams: applied loads control changes in shear force, and shear force controls changes in bending moment. Once this logic is understood, these diagrams are no longer something to be memorized by rote, but the natural result of equilibrium conditions.
Typical Case 1: Simply Supported Beam with a Concentrated Load
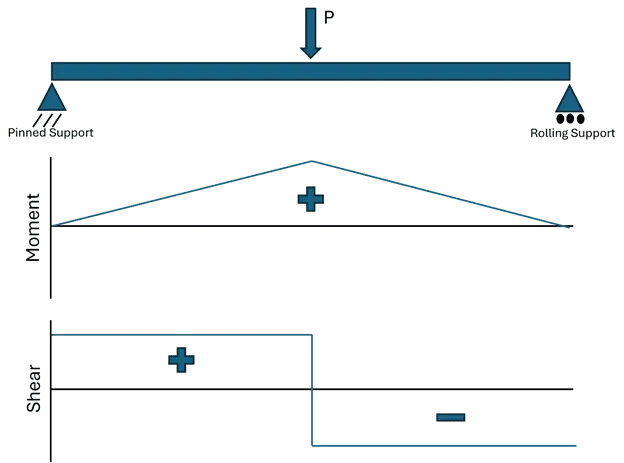
Consider a simply supported beam of length L carrying a concentrated load P at midspan. By symmetry, the reaction at each support is P/2.
Shear force diagram and bending moment diagram for a simply supported beam with a midspan concentrated load
Shear Force Diagram Analysis
- Starting from the left support, the shear force immediately jumps to +P/2
- It remains at this value until the point where the concentrated load acts at midspan
- At the concentrated load, the shear force suddenly drops by P, becoming −P/2
- It remains constant until the right support, where the right support reaction finally brings it back to zero
Bending Moment Diagram Analysis
Because the shear force is constant over each half-span, the bending moment varies linearly over each half. It rises from zero at the left support to its maximum value at midspan, then decreases linearly back to zero at the right support.
Maximum bending moment at midspan (concentrated load case)
This is a standard benchmark case in structural analysis and also an effective verification case for beam-element FEA models — because its theoretical solution is exact and widely known, it is very suitable as a first model validation check.
Typical Case 2: Simply Supported Beam with a Uniformly Distributed Load
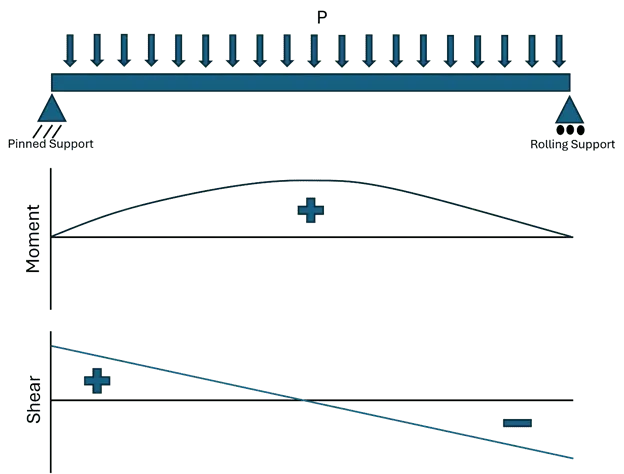
Consider a simply supported beam carrying a uniformly distributed load w over its entire span. The reaction at each support is wL/2.
Parabolic bending moment diagram for a simply supported beam with a uniformly distributed load
Shear Force Diagram
Because the load is continuously distributed, the shear force does not jump abruptly, but decreases linearly along the span:
The shear force varies linearly along the span, decreasing from +wL/2 to −wL/2
Bending Moment Diagram
Because the shear force varies linearly, the bending moment diagram is parabolic:
Parabolic distribution, reaching its maximum at x = L/2
Maximum bending moment at midspan (uniformly distributed load case)
This case clearly demonstrates the classic progression: uniformly distributed load → linear shear force → parabolic bending moment.
Summary Comparison of Common Cases
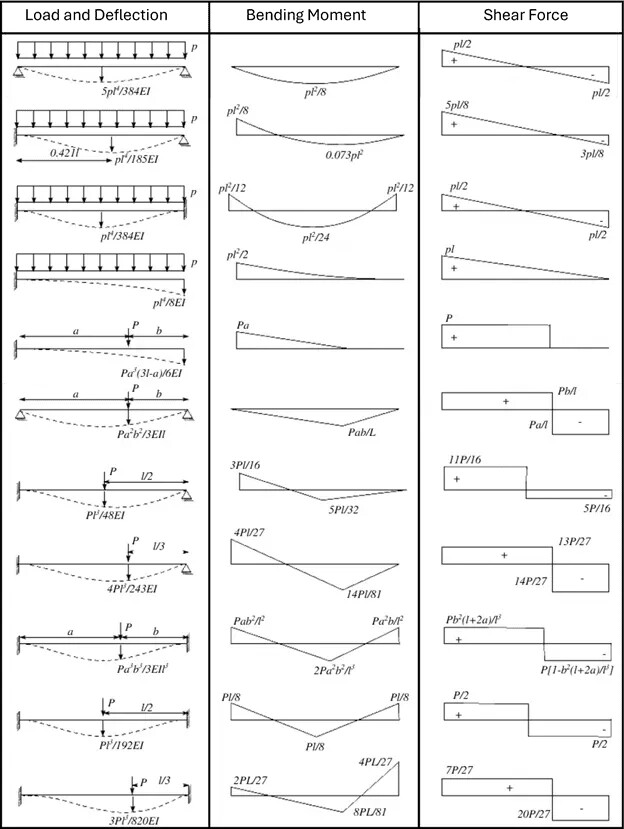
The table below summarizes common bending moment and shear force diagram shapes in engineering practice, with special attention to fixed-end boundary conditions — a fixed end can transmit both force and moment, so the end moment is not zero.
| Beam Type / Load Case | Shear Force Diagram Characteristics | Bending Moment Diagram Characteristics | Location of Maximum Bending Moment |
|---|---|---|---|
| Simply supported beam / midspan concentrated force | Two constant segments, sudden jump at the middle | Triangular (two straight-line segments) | Midspan, M = PL/4 |
| Simply supported beam / uniformly distributed load | Linear (from + to −) | Parabola | Midspan, M = wL²/8 |
| Cantilever beam / end concentrated force | Constant over the entire span | Linear (maximum at the root) | Fixed end, M = PL |
| Cantilever beam / uniformly distributed load | Linear (zero at the free end) | Parabola (maximum at the root) | Fixed end, M = wL²/2 |
| Fixed-fixed beam / uniformly distributed load | Linear (zero at midspan) | Composite curve, negative end moments | Ends −wL²/12; midspan +wL²/24 |
Why These Diagrams Are Still Used
It is easy to think that shear force and bending moment diagrams only apply to textbook beam problems, but they remain highly useful in engineering practice. They tell you where demand is concentrated, where stress may peak, and how loads flow through a member.
This makes their value extend far beyond hand calculations. For finite element models, they are often the fastest sanity check. If a simulation predicts peak stress in a location where the bending moment should be negligible, it is worth investigating further. The issue may come from:
- Incorrect boundary condition settings
- Incorrect load application method
- Poor mesh quality
- Misunderstanding the stress component actually being plotted
Relationship Between Bending Moment and Bending Stress
Regions of high bending moment usually correspond to the highest bending stress, with the relationship:
σ: bending stress
y: distance from the neutral axis
I: second moment of area
Because bending moment is related to curvature, the bending moment diagram also indicates where the beam bends most significantly. The shear force diagram likewise cannot be ignored, especially near supports and in short, deep beams, where transverse shear stress is not negligible.
The Importance of Sign Conventions
Sign conventions are one of the most common sources of confusion. Different textbooks, instructors, and software packages define positive shear force and positive bending moment differently. This does not change the mechanics itself, but it does change the appearance of the plotted diagrams.
The key is consistency. If positive bending moment is defined as “sagging,” then the corresponding stress interpretation and equilibrium equations must follow the same convention. Otherwise, sign errors can appear quickly and propagate into incorrect design conclusions.
In practice, most errors in beam diagrams are not caused by difficult mathematics, but by:
- Inconsistent signs
- Missing support reactions
- Diagram shapes that do not match the applied load type
Finite Element Analysis and Model Validation
- For beam element models, the solver usually outputs shear force and bending moment resultants directly, so the connection is direct
- For shell element and solid element models, this connection still exists, but it must be interpreted through stresses, reaction forces, and section resultants
In any case, an understanding of classical beam behavior gives you a powerful checking tool for judging whether a model is behaving as expected. This is exactly why these diagrams remain important today: they simplify complex structural responses and help bridge the gap between closed-form analytical theory and numerical simulation. Most importantly, they make it easier to distinguish between the correct answer and a result that merely looks plausible but is wrong.
Bending moment diagrams and shear force diagrams are not just academic tools; they are direct expressions of how a beam carries loads internally. Once you understand their relationship to equilibrium conditions and beam deformation, they become one of the most efficient tools for interpreting structural behavior.
For simple beams, these diagrams can be drawn by hand in a few minutes. For more complex systems, even when the analysis is performed numerically, the same principles still apply:
Load → drives shear force → drives bending moment → drives bending response
This chain is fundamental to structural analysis, whether the answer comes from pencil-and-paper calculations or a full FEA model.