1) Viscosity Curve
The purpose of generating a viscosity curve is to select an appropriate injection speed that will not cause significant changes in melt viscosity when minor fluctuations occur in various parameters. Fluctuations between molds should be minimized to ensure repeatability of product quality.
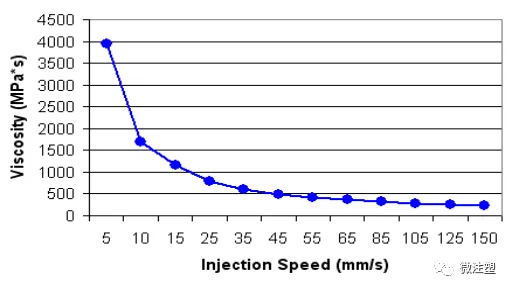
Referring to the viscosity curve shown above, we can see that when the injection speed exceeds 55mm/s, the viscosity of the melt remains very stable. Therefore, setting the injection speed to 65mm/s ensures consistency during the filling stage. Minor fluctuations in parameters will not cause significant changes in melt viscosity.
Of course, there may be special cases where this optimized speed cannot be used, such as when reducing gate blush. In such cases, appearance is prioritized; however, this optimized speed should still serve as a reference for the injection profile, such as starting with a low speed to reduce gate blush, and then quickly increasing to the optimized speed.
2) Flow Balance Test
This test is only necessary in multi-cavity molds, such as 2-cavity or multi-cavity molds. The purpose is to check the maximum deviation percentage between the cavities during different filling stages.
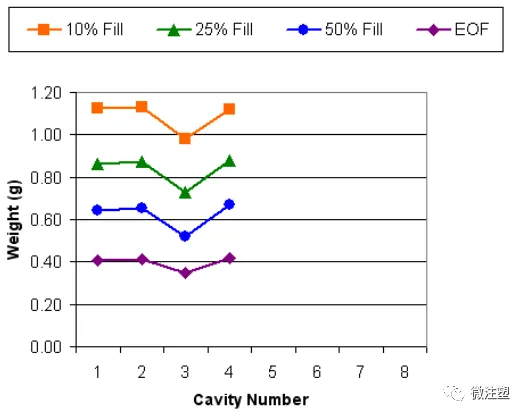
Filling imbalance may or may not be acceptable, depending on the product quality requirements. This information is best decided after completing the appearance forming window (Step 4).
- If the product can be adequately held under pressure and the forming window is large, check if the product dimensions are within tolerance. If they are, filling imbalance may be acceptable.
- If the forming window is small and the first cavity to fill shows flash, while other cavities show short shots or sink marks, identify the cause of the filling imbalance.
Filling imbalance typically has four main causes:
- Different runner sizes
- Different gate sizes
- Different vent sizes
- Cooling differences (though this often has a smaller impact when the machine is just started)
Another cause can be shear-induced imbalance, especially in 8-cavity cold runner molds.
3) Pressure Drop Test
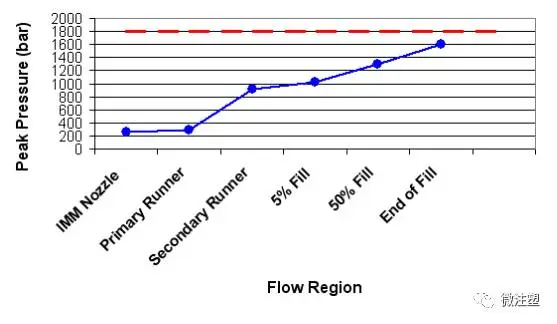
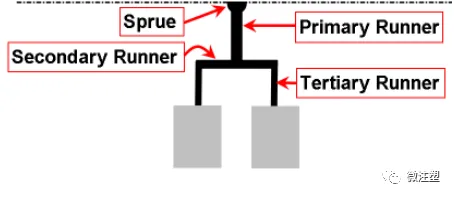
The purpose of the pressure drop test is to assess the pressure loss at different stages of filling. This typically includes the machine nozzle, vertical runner, main runner, sub-runner, gate, and the end of the filling stage.
The molding process should not operate at the machine’s maximum pressure. For instance, if the machine’s maximum pressure is 180 bar, the maximum pressure required during filling should not reach 180 bar. If this happens, it indicates that the screw requires more pressure to achieve the set injection speed, but due to pressure limitations, it cannot reach it. This situation is referred to as “pressure limited.”
Typically, the injection process should not exceed 90% of the machine’s maximum pressure. In the pressure drop curve, if it enters the “pressure limited” zone or exceeds 90% of the machine pressure, identify the steep portion of the curve and attempt to reduce pressure loss in that area. For example, in the image, the large pressure drop in the sub-runner indicates that a lot of force is required to push the melt through. Increasing the diameter of this section of the runner can help reduce pressure.
4) Appearance Forming Window
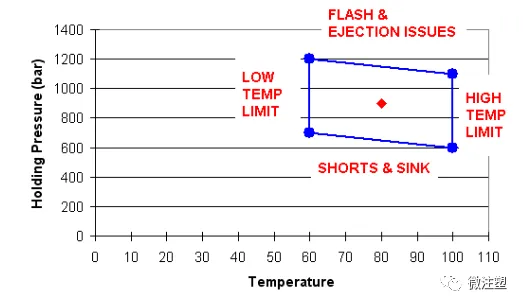
The appearance forming window is a very important test. It typically involves holding pressure and material temperature (for amorphous materials), or holding pressure and mold temperature (for crystalline materials).
The appearance forming window reveals how much room is available for process adjustments while still obtaining an aesthetically acceptable product. The ideal scenario is to have a large forming window. If the window is small, it becomes easier to produce quality defects. For example, if the window is small, fluctuations in the process can easily lead to short shots or flash. A robust process should have a large forming window to compensate for inherent process fluctuations.
The appearance forming window also provides the upper and lower limits for material temperature/mold temperature and holding pressure that can be used during subsequent molding trials or DOE experiments.
5) Gate Freezing Test
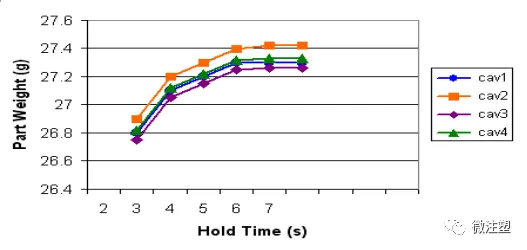
For cold runner molds or semi-cold runner molds (hot-to-cold), to ensure repeatability between molds, holding pressure must be maintained until the gate is fully frozen.
After the curve is generated, select a time when the product weight stabilizes. In the image above, the product weight no longer increases after 7 seconds, so to be safe and compensate for process fluctuations, the holding time should be set to 8 seconds.
Note that this extra 1 second in the holding phase will not increase the cycle time, as during this period, the gate should have already frozen, and only the cold runner will be briefly held under pressure. Meanwhile, the product will already be starting to cool. Therefore, the additional 1 second should be deducted from the cooling time to ensure the same cycle time.
6) Mold Temperature Profile
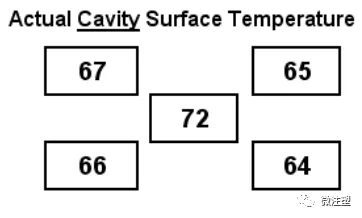
The purpose of the mold temperature profile is to record the distribution of the mold surface temperature immediately after product ejection. It can be used to confirm whether the cooling water channels are functioning or if there are “hot spots.”
In addition, this information can be used later to troubleshoot. For example, when product dimensions are inconsistent, it can help confirm whether the mold surface temperature is the same as before.
Temperature measurements must be taken with a contact-type high-temperature thermometer.
Note that after initial startup or shutdown, mold temperature will gradually rise to a stable state. Therefore, measurements should only be taken after the mold temperature stabilizes (at least after 10 shots).
The image provides 5 frames, which can be applied to different molds depending on the situation. For example, when testing a 4-cavity mold, each cavity should have a measurement point recorded at corresponding positions in the four corners, with one center frame left empty. If it is a single-cavity mold, all 5 frames should be used to represent different measurement locations.