When using APDL to generate contour plots, some necessary information is displayed in the upper left corner, such as result type, time step, load step, result coordinate system type, and values like DMX, SMX, and SMN. Many beginners may not fully understand these three values, so here’s a brief explanation:
- DMX: Maximum value of the total displacement of the model.
- SMX: Maximum value within the current contour plot content.
- SMN: Minimum value within the current contour plot content.
The “total displacement” here refers to the square root of the sum of squares of displacements in three directions, essentially the maximum value in the PLNSOL, U, SUM plot. By default, DMX remains constant and does not change with the contour plot content.
Here are screenshots to explain further:
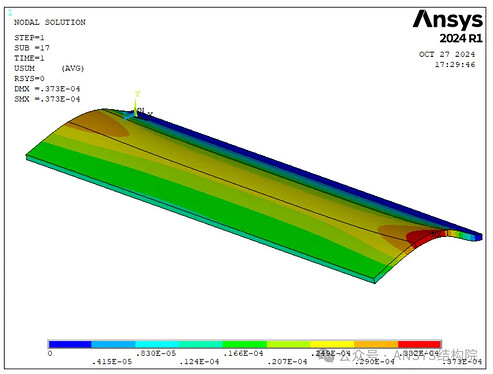
- Total Displacement Plot — Command:
PLNSOL, U, SUM
- DMX = SMX = 0.373e-4, with the contour plot’s maximum value at 0.373e-4.
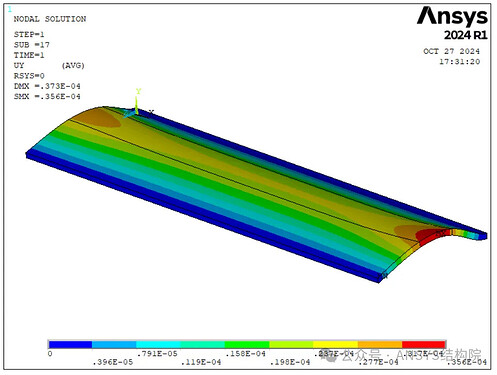
- Y-Displacement Contour Plot — Command:
PLNSOL, U, Y
- DMX = 0.373e-4
- SMX = 0.356e-4, which is the maximum value in the contour plot for this model.
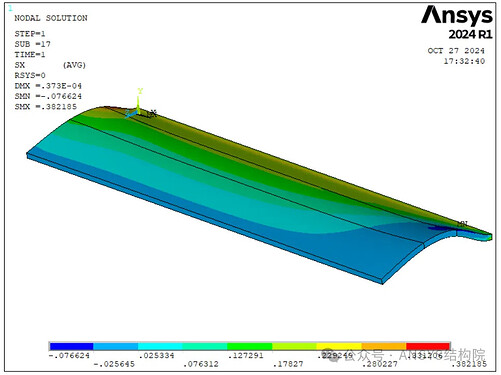
- X-Component Stress Contour Plot — Command:
PLNSOL, S, X
- DMX = 0.373e-4
- SMX = 0.3822
- SMN = -0.0766*
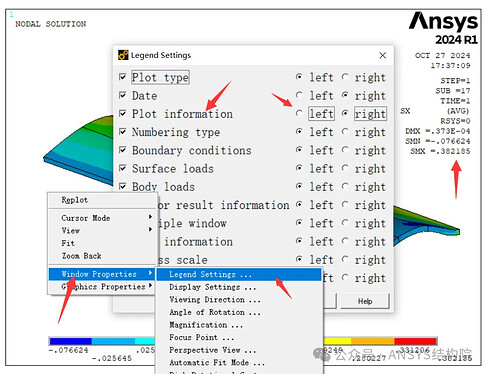
To modify the display settings for DMX, SMX, and SMN, right-click in the window and select Legend Settings.


