1. Fatigue Curve and Symmetric Cyclic Fatigue Curve
(a) Fatigue Curve and Fatigue Limit
A fatigue curve, or S-N curve, represents the relationship between fatigue stress and fatigue life. It is fundamental for determining the fatigue limit and establishing fatigue stress criteria. In 1860, Wöhler introduced the concept of fatigue curves and fatigue limits while studying railroad axle fractures, hence the curve is also known as the Wöhler curve.
For metals with strain aging, such as carbon steel and ductile iron, when the cyclic stress drops to a critical value, the low-stress portion of the curve becomes horizontal. This indicates that the specimen can undergo an infinite number of stress cycles without fatigue failure, with the corresponding stress termed the fatigue limit, denoted as σ-1 (for symmetric cycles, r = -1). For such materials, if no fractures occur within 10710^7107 cycles, it is assumed that they can withstand infinite cycles without failure, so 10710^7107 cycles is often used as a benchmark for measuring the fatigue limit.
For other materials, such as aluminum alloys and stainless steel, the S-N curve does not level off; instead, the number of cycles increases continuously as stress decreases. In such cases, a specific cycle count must be chosen as the conditional fatigue limit or finite life fatigue limit according to usage requirements.
(b) Determining the Fatigue Curve
Fatigue curves are usually obtained through rotating bending fatigue tests, with a four-point bending apparatus. The high-stress (finite life) region of the S-N curve is measured using grouped testing at 3–4 stress levels, with around 5 specimens tested at each level. After data processing, the median fatigue life (with a survival rate of 50%) is calculated.
The σ-1 value, determined by the up-and-down method, represents the lowest stress level on the S-N curve and, along with the grouped test results, is used to fit a line or curve, yielding the 50% survival rate median S-N curve.
(c) Fatigue Limits under Different Stress States
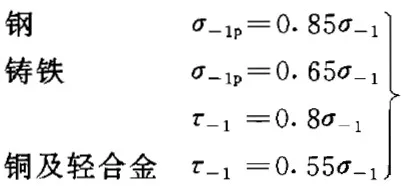
The fatigue limit varies with different stress states for the same material, but certain correlations exist. Experiments show a relationship between the symmetric bending fatigue limit and the symmetric tension-compression and torsion fatigue limits.
(d) Relationship between Fatigue Limit and Static Strength
Tests show that the higher the tensile strength of a metal, the greater its fatigue limit. For low- and medium-strength steels, the fatigue limit generally has a linear relationship with tensile strength. When σb (tensile strength) is lower, the relation can be approximated as σ-1 = σb. For higher σb values, this linearity deviates due to decreased plasticity and fracture toughness, which facilitates crack formation and propagation.
2. Fatigue Diagram and Asymmetric Cyclic Fatigue Limit
Many components operate under asymmetric cyclic loads, so determining the asymmetric cyclic fatigue limit is essential for the design and material selection of these parts. The fatigue diagram for various asymmetric cycles is typically obtained using engineering plotting methods. There are two main types of fatigue diagrams:
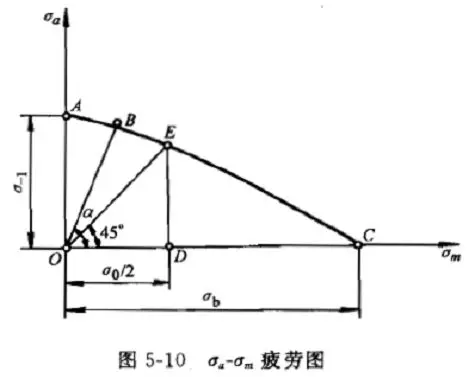
1. σa-σm Fatigue Diagram
This diagram decomposes the fatigue limit σr, represented by σmax under various stress ratios (r), into σa and σm values, and the ABC curve is plotted in this coordinate system, forming the σa-σm fatigue diagram.
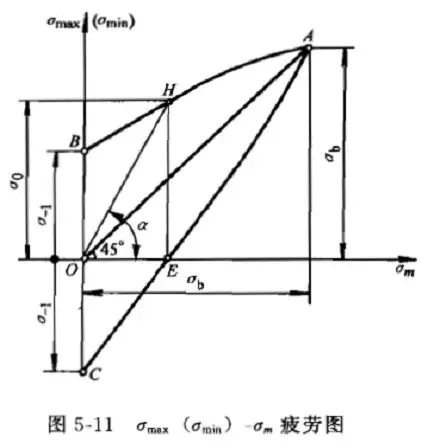
2. σmax(σmin)-σm Fatigue Diagram
By plotting the fatigue limit under different stress ratios using σmax(σmin) and σm on the coordinate system, a fatigue diagram is formed. Curve AHB represents the fatigue limit σmax under different values of r. As mean stress or stress ratio increases, the fatigue limit also increases, but the stress amplitude (a) decreases.
3. Fatigue Overload Resistance
Metal components may occasionally experience short-term overloads, which may or may not affect the original fatigue limit depending on the overload stress and the corresponding cumulative cycles. If a metal operates above the fatigue limit for a set number of cycles, its fatigue limit and lifespan can be reduced, causing overload damage. The material’s resistance to fatigue overload damage is expressed through the overload damage boundary or overload damage zone.
The overload damage boundary is experimentally determined by measuring overload stress levels and the number of cycles at which fatigue life starts to reduce, connecting these points to form the boundary. The shaded area between the boundary and the high-stress linear segment of the fatigue curve (representing the number of cycles for overload failure) is called the overload damage zone. Components operating in this area have reduced fatigue limits, with the reduction being more pronounced near the endurance value. A steeper overload damage boundary (or endurance value) and a narrower damage zone indicate stronger resistance to fatigue overload.
4. Fatigue Notch Sensitivity
Components often contain features like steps, corners, key slots, oil holes, and threads, which act as notches and cause stress concentration. Therefore, understanding the effect of notches on fatigue limits is important. Fatigue notch sensitivity assesses how stress concentration due to notches affects the fatigue limit, with two possible extremes:
- Kf=Kt – This implies that the stress distribution during fatigue for notched specimens is the same as under elastic conditions, with no redistribution, leading to maximum reduction in fatigue limit (qf = 1), indicating maximum notch sensitivity.
- Kf=1,σ-1=σ-1N – This indicates no reduction in fatigue limit due to notch, suggesting significant stress redistribution during fatigue, with complete elimination of stress concentration effects (qf = 0), indicating minimal notch sensitivity.
The qf value reflects the material’s ability to redistribute stress during fatigue, reducing stress concentration effects. For high-cycle fatigue, most metals are highly sensitive to notches; in low-cycle fatigue, metals are less sensitive due to stress relaxation in the plastic zone near the notch root.